Mastering Forex Trading Charts: Your Roadmap to Success

What Are Forex Trading Charts?
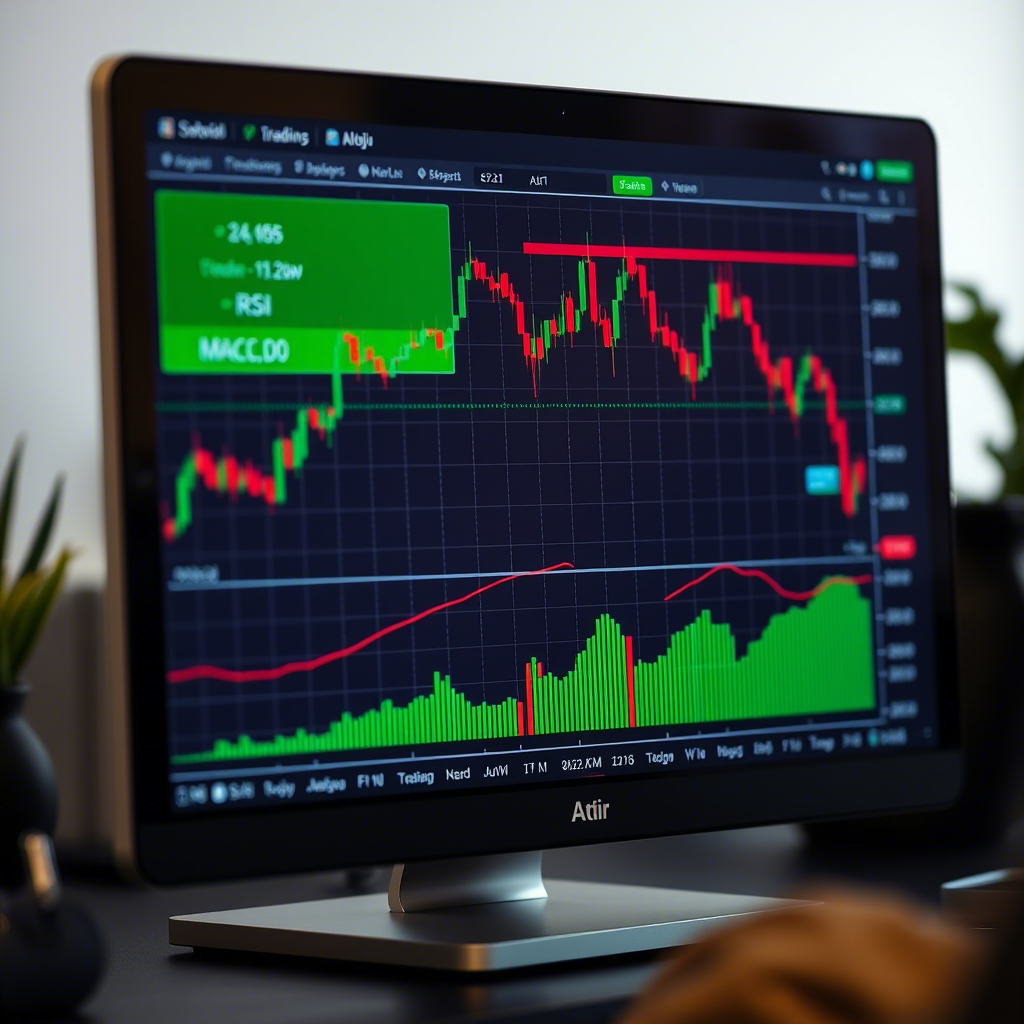
Forex trading charts are graphical representations of a currency pair’s price movements over time. They display how prices change, allowing traders to identify patterns, trends, and potential entry or exit points. Charts are typically accessed through trading platforms like MetaTrader 4 (MT4), MetaTrader 5 (MT5), or TradingView, and they form the foundation of technical analysis.
Charts are like a trader’s map, translating raw market data into actionable insights. By mastering them, you can decode the market’s behavior and improve your trading outcomes.
Why Charts Are Essential in Forex Trading
Charts are a cornerstone of forex trading for several reasons:
-
Visualize Price Action: Charts make it easy to see trends, reversals, or consolidation at a glance.
-
Support Technical Analysis: They enable the use of indicators, patterns, and levels to predict future movements.
-
Guide Decision-Making: Charts help determine when to enter or exit trades based on data, not emotions.
-
Track Market History: Historical data on charts reveals how prices reacted to past events, aiding strategy development.
-
Suit All Styles: From scalping to long-term trading, charts are versatile for any approach.
Without charts, traders would be navigating the forex market blind, relying on guesswork instead of evidence.
Types of Forex Trading Charts
Forex charts come in various formats, each offering unique perspectives on price action. Here are the three most common types:
1. Line Charts
What They Are: Line charts plot a single line connecting closing prices over a chosen timeframe (e.g., hourly, daily).
Features:
-
Simple and easy to read, ideal for beginners.
-
Show the overall trend without intraday noise.
-
Limited detail, as they ignore open, high, and low prices.
Best For: Long-term traders assessing broad market direction.
2. Bar Charts
What They Are: Bar charts display price data using vertical bars, showing the open, high, low, and close (OHLC) for each period.
Features:
-
More detailed than line charts, revealing price ranges.
-
Each bar represents a timeframe (e.g., 1 hour, 1 day).
-
Useful for identifying volatility and price gaps.
Best For: Swing traders analyzing price ranges and trends.
3. Candlestick Charts
What They Are: Candlestick charts use “candles” to show OHLC data, with colored bodies indicating bullish (price up) or bearish (price down) movements.
Features:
-
Highly visual, with patterns like doji, engulfing, or hammer signaling reversals or continuations.
-
Show momentum and trader sentiment through candle size and wicks.
-
Most popular among forex traders for their depth.
Best For: All traders, especially day traders and scalpers seeking precise entries.
Key Elements of Forex Charts
To use charts effectively, understand these core components:
-
Timeframes: Charts can display data in minutes (M1, M5), hours (H1, H4), days (D1), or weeks (W1). Short timeframes suit scalping; longer ones suit swing or position trading.
-
Price Axis: The vertical axis shows price levels, helping identify support and resistance.
-
Trendlines: Lines drawn to connect highs or lows, indicating uptrends or downtrends.
-
Support and Resistance: Horizontal levels where prices tend to bounce (support) or reverse (resistance).
-
Patterns: Formations like head and shoulders or triangles that signal potential price moves.
Tools for Analyzing Forex Charts
Charts become powerful when paired with analytical tools. Here are the essentials:
1. Technical Indicators
Indicators are mathematical calculations overlaid on charts to signal trends or reversals:
-
Moving Averages: Smooth price data to identify trends (e.g., 50-day MA).
-
Relative Strength Index (RSI): Measures overbought (above 70) or oversold (below 30) conditions.
-
Bollinger Bands: Show volatility and potential breakout levels.
-
MACD: Highlights momentum and trend changes.
2. Drawing Tools
Platforms like MT4 or TradingView offer tools to mark charts:
-
Trendlines: Connect swing highs or lows to map trends.
-
Fibonacci Retracements: Identify potential reversal levels based on historical price moves.
-
Channels: Parallel lines to track price ranges.
3. Candlestick Patterns
Candlestick formations provide insights into market sentiment:
-
Bullish Engulfing: Signals a potential uptrend.
-
Doji: Indicates indecision, often preceding reversals.
-
Hammer: Suggests a bullish reversal after a downtrend.
4. Volume Indicators
While forex lacks centralized volume data, some platforms estimate it. High volume at support or resistance strengthens the level’s significance.
Strategies for Trading with Charts
Charts are the foundation of many forex strategies. Here are three popular approaches:
1. Trend Following
What It Is: Trading in the direction of the prevailing trend using chart patterns and indicators.
How It Works:
-
Identify the trend with moving averages or trendlines on a daily chart.
-
Enter buys in uptrends or sells in downtrends when prices pull back to support/resistance.
-
Use stop-losses below support (for buys) or above resistance (for sells).
Best For: Swing traders seeking sustained moves.
2. Breakout Trading
What It Is: Entering trades when prices break through key levels on the chart.
How It Works:
-
Mark consolidation zones (e.g., triangles or ranges) on an hourly chart.
-
Place buy/sell orders above/below the breakout level.
-
Confirm with volume or indicators like RSI to avoid false breakouts.
Best For: Day traders during volatile sessions.
3. Support and Resistance Trading
What It Is: Trading bounces or reversals at key chart levels.
How It Works:
-
Identify support/demand or resistance/supply zones on a 4-hour chart.
-
Enter buys near support or sells near resistance, using candlestick patterns for confirmation.
-
Set stop-losses beyond the zone to manage risk.
Best For: All traders, especially beginners.
Tips for Using Forex Charts Effectively
Maximize your chart analysis with these practical tips:
-
Choose the Right Timeframe: Use short timeframes (M5, M15) for scalping, longer ones (H4, D1) for swing trading.
-
Keep It Simple: Avoid cluttering charts with too many indicators; focus on 2-3 reliable tools.
-
Practice in a Demo Account: Test chart-based strategies risk-free to build confidence.
-
Combine with Fundamentals: Align chart signals with economic news (e.g., NFP, rate decisions) for stronger trades.
-
Review Regularly: Analyze past trades to refine your chart-reading skills.
Common Mistakes to Avoid
Steer clear of these pitfalls when using charts:
-
Overcomplicating Analysis: Too many indicators lead to confusion and indecision.
-
Ignoring Timeframes: Signals on a 5-minute chart may conflict with a daily trend.
-
Chasing Price: Entering trades late after a breakout without confirmation risks losses.
-
Neglecting Risk Management: Always use stop-losses and risk 1-2% per trade.
-
Misreading Patterns: Confirm patterns with other signals to avoid false setups.
Tools and Platforms for Forex Charts
Leverage these resources for top-notch charting:
-
MetaTrader 4/5: Industry-standard platforms with robust charting and indicators.
-
TradingView: Browser-based, with advanced charting and a community for sharing ideas.
-
cTrader: Sleek design with detachable charts and Level II pricing.
-
Broker Apps: Many brokers offer proprietary platforms with built-in charting tools.
Conclusion
Forex trading charts are your window into the market, transforming raw price data into actionable insights. By mastering line, bar, and candlestick charts, and pairing them with indicators, patterns, and sound risk management, you can unlock profitable opportunities. Start with a demo account to practice reading charts, keep your analysis simple, and align signals with economic events for better accuracy. Whether you’re scalping EUR/USD or swing trading GBP/JPY, charts are your roadmap to success in the forex market. Dive in today and start charting your path to profits!


