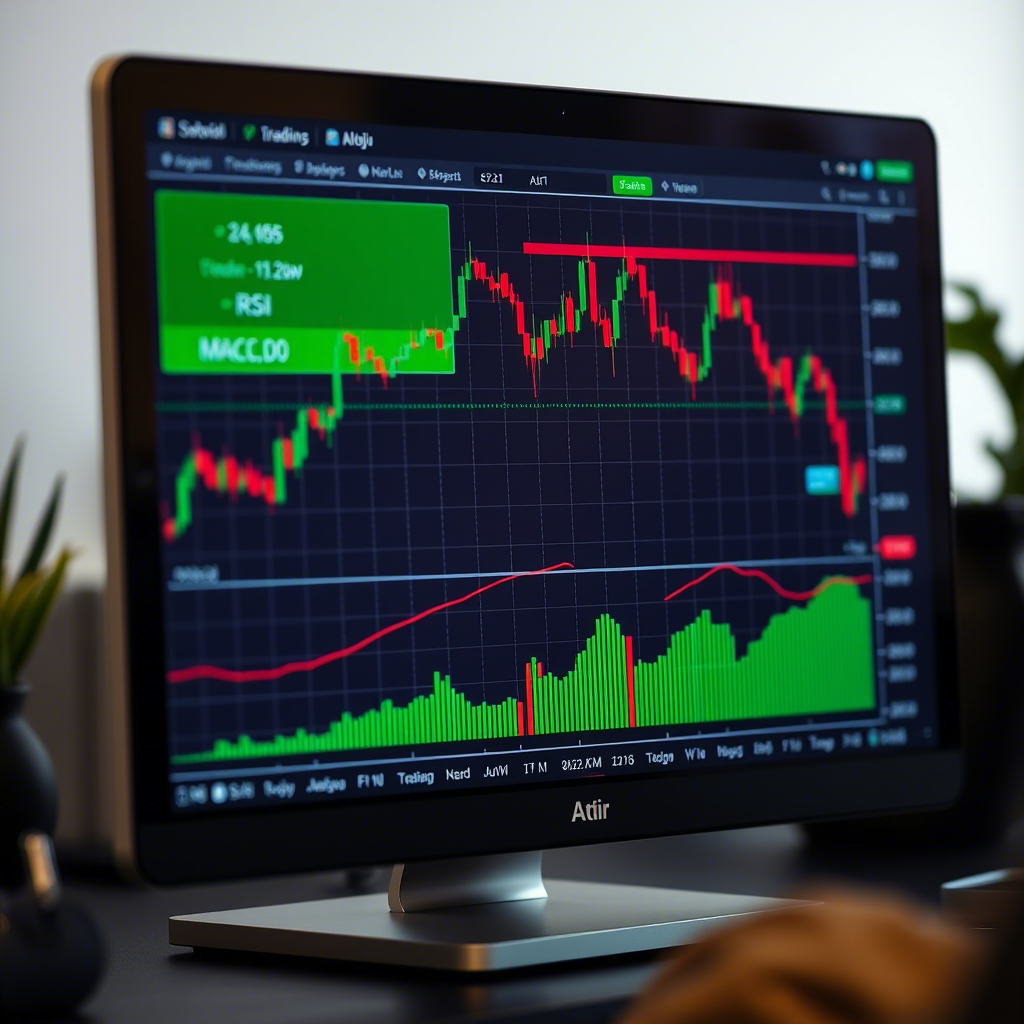
Mastering Technical Analysis in Currency Trading: A Beginner’s Guide

What is Technical Analysis in Currency Trading?
Technical analysis involves analyzing past price data, chart patterns, and market indicators to forecast future price movements. Unlike fundamental analysis, which focuses on economic factors like interest rates or GDP, technical analysis assumes that all relevant information is already reflected in the price. By studying charts and patterns, traders identify trends, support and resistance levels, and potential entry or exit points for trades.
In currency trading, technical analysis is especially valuable due to the forex market’s high liquidity and volatility. It’s used by traders of all levels to navigate currency pairs like EUR/USD, GBP/JPY, or USD/JPY, whether they’re scalping for quick profits or holding positions for weeks.
Why Technical Analysis Matters
Technical analysis helps traders:
-
Spot Trends: Identify whether a currency pair is moving up, down, or sideways.
-
Time Trades: Pinpoint optimal moments to enter or exit the market.
-
Manage Risk: Set stop-loss and take-profit levels based on price patterns.
-
Stay Objective: Rely on data rather than emotions or news-driven impulses.
Key Tools of Technical Analysis
Technical analysis relies on a variety of tools, each offering unique insights into market behavior. Here are the most essential ones for currency traders:
1. Price Charts
Charts are the foundation of technical analysis, displaying price movements over time. The three main types are:
-
Line Charts: Show closing prices, ideal for spotting long-term trends.
-
Bar Charts: Display open, high, low, and close prices for a period, offering more detail.
-
Candlestick Charts: Popular in forex, these show price action vividly, with “candles” indicating bullish or bearish sentiment.
2. Trend Lines and Channels
Trend lines connect higher lows (uptrend) or lower highs (downtrend) to visualize market direction. Channels add parallel lines to show price ranges, helping traders identify breakout or reversal points.
3. Support and Resistance Levels
Support is a price level where a currency pair tends to stop falling, as buyers step in. Resistance is where it struggles to rise, as sellers dominate. These levels guide traders on where to enter, exit, or set stop-loss orders.
4. Technical Indicators
Indicators are mathematical calculations based on price or volume data. Popular ones include:
-
Moving Averages (MA): Smooth out price data to identify trends. Simple Moving Averages (SMA) and Exponential Moving Averages (EMA) are common.
-
Relative Strength Index (RSI): Measures momentum on a 0-100 scale. Above 70 indicates overbought; below 30 suggests oversold.
-
MACD (Moving Average Convergence Divergence): Shows trend direction and momentum by comparing two moving averages.
-
Bollinger Bands: Plot volatility bands around a moving average, signaling potential breakouts or reversals.
5. Chart Patterns
Patterns reveal potential price movements. Common ones include:
-
Head and Shoulders: Signals a trend reversal.
-
Double Top/Bottom: Indicates resistance or support levels.
-
Triangles: Suggest continuation or breakout, depending on the shape (ascending, descending, or symmetrical).
Benefits of Technical Analysis in Currency Trading
Technical analysis offers several advantages for forex traders:
1. Versatility
It works across timeframes, from 1-minute charts for scalping to weekly charts for long-term trading, suiting various strategies.
2. Objective Decision-Making
By focusing on data, technical analysis reduces emotional biases, helping traders stick to their plans.
3. Wide Applicability
The same tools apply to all currency pairs, from major pairs like EUR/USD to exotic ones like USD/TRY, making it easy to diversify.
4. Enhanced Timing
Technical analysis pinpoints precise entry and exit points, improving trade efficiency and profitability.
How to Start Using Technical Analysis in Currency Trading
Ready to apply technical analysis to forex? Follow these steps to get started:
Step 1: Learn the Basics
Familiarize yourself with charts, patterns, and indicators. Start with candlestick charts and simple tools like moving averages or support/resistance. Free resources like YouTube tutorials, broker webinars, or books like Technical Analysis of the Financial Markets by John Murphy are excellent starting points.
Step 2: Choose a Trading Platform
Select a broker with a robust platform that supports technical analysis tools. MetaTrader 4 (MT4) and MetaTrader 5 (MT5) are popular choices, offering built-in indicators, charting tools, and customization. Ensure the broker is regulated by authorities like the FCA, CFTC, or ASIC.
Step 3: Practice on a Demo Account
Use a demo account to experiment with technical analysis without risking real money. Test indicators, draw trend lines, and identify patterns on currency pairs like EUR/USD or GBP/USD. Spend weeks or months refining your skills.
Step 4: Develop a Trading Strategy
Create a strategy that combines multiple tools. For example, use moving averages to confirm trends, RSI to avoid overbought/oversold trades, and support/resistance for entry/exit points. Define your risk management rules, like setting stop-loss orders or risking only 1-2% of your account per trade.
Step 5: Start Trading and Analyze Results
Once confident, trade with a small real account. Keep a trading journal to record your setups, indicator signals, and outcomes. Regularly review your journal to improve your strategy.
Risks and Limitations of Technical Analysis
While powerful, technical analysis has its challenges:
1. False Signals
Indicators and patterns can produce misleading signals, especially in volatile markets. Always confirm signals with multiple tools.
2. Over-Reliance
Focusing solely on technical analysis ignores fundamental factors like economic news or central bank policies, which heavily impact forex prices.
3. Learning Curve
Mastering technical analysis takes time and practice. Beginners may feel overwhelmed by the variety of tools and patterns.
4. Market Noise
Short-term charts can be noisy, with random price fluctuations obscuring trends. Longer timeframes often provide clearer signals.
Tips for Mastering Technical Analysis
Boost your technical analysis skills with these practical tips:
1. Start Simple
Focus on a few tools, like candlesticks and moving averages, before exploring complex indicators like Fibonacci retracements or Ichimoku Clouds.
2. Combine with Fundamental Analysis
Use technical analysis for timing trades and fundamental analysis (e.g., economic calendars) to understand broader market drivers.
3. Test Strategies
Backtest your strategy on historical data to see how it performs. Most platforms like MT4 offer backtesting tools.
4. Stay Disciplined
Avoid chasing trades based on unconfirmed signals. Stick to your strategy and risk management rules.
5. Keep Learning
Markets evolve, so stay updated on new tools and techniques through blogs, forums, or trading communities.
Conclusion
Technical analysis is an essential skill for currency traders, offering a data-driven way to navigate the volatile forex market. By mastering tools like charts, indicators, and patterns, beginners can make smarter trading decisions and improve their profitability. While it requires time and practice, the rewards of disciplined technical analysis are well worth the effort.
To succeed, start with simple tools, practice on a demo account, and combine technical insights with fundamental awareness. Whether you’re scalping EUR/USD or swing trading GBP/JPY, technical analysis can unlock the potential of currency trading. Dive in, stay patient, and chart your path to forex success.


