Candlestick Patterns in Currency Trading: A Beginner’s Guide to Reading the Market
Candlestick Patterns in Currency Trading: A Beginner’s Guide to Reading the Market
What Are Candlestick Patterns in Currency Trading?
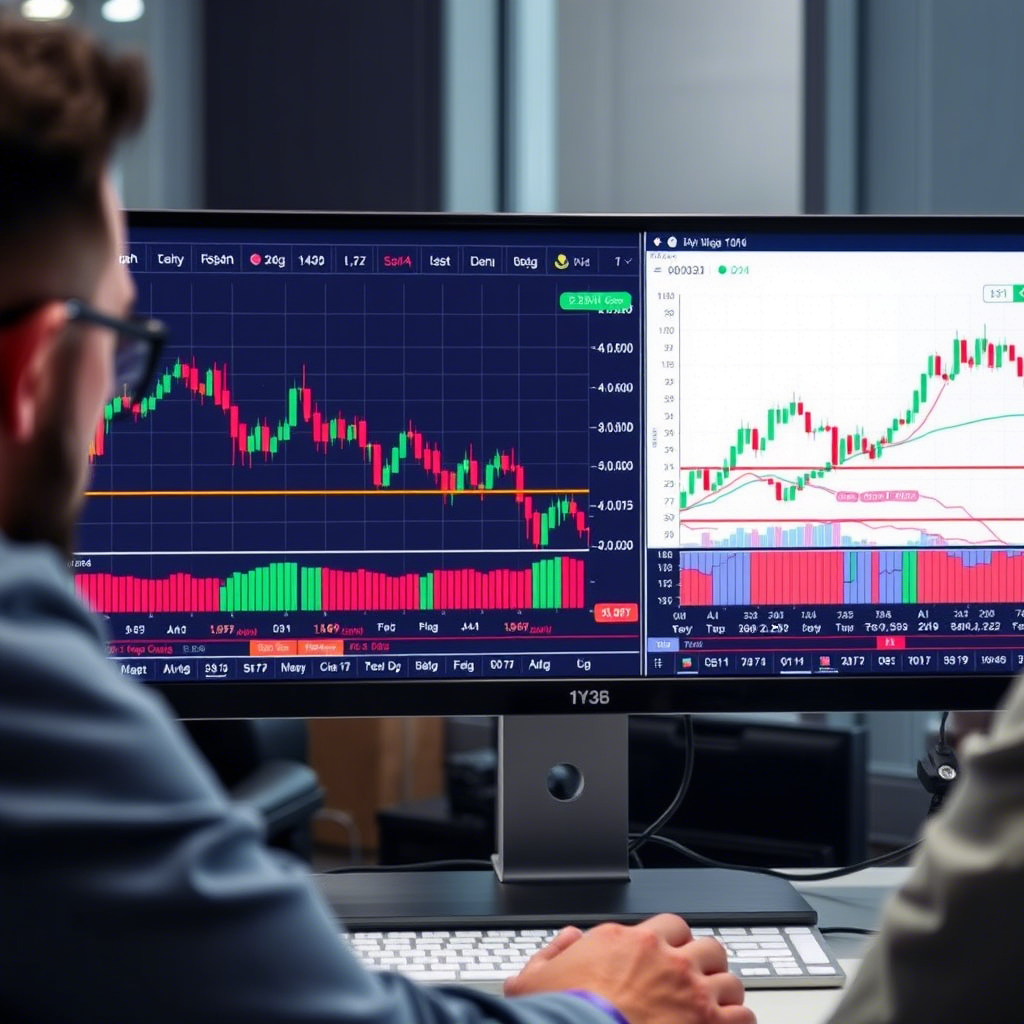
Candlestick patterns are graphical representations of price movements over a specific time period, displayed on forex charts. Each candlestick shows four key price points: the open, close, high, and low. The “body” of the candle represents the range between the open and close, while “wicks” or “shadows” extend to the high and low, revealing price volatility.
In forex, candlesticks form patterns that signal potential market behavior, such as reversals (price changing direction) or continuations (price maintaining its trend). Originating in 18th-century Japan, candlestick charts are now a universal tool, helping traders read market sentiment and make informed decisions.
Why Candlestick Patterns Matter
Candlestick patterns are vital because they:
-
Provide clear visual cues about buyer and seller dynamics.
-
Help predict price movements, from short-term scalping to long-term trends.
-
Work across all currency pairs, from majors like EUR/USD to exotics like USD/TRY.
-
Enhance trading strategies when combined with other technical tools.
Types of Candlestick Patterns
Candlestick patterns are categorized into single, double, and multi-candle formations, each with unique implications. Here are the most common ones:
1. Single Candlestick Patterns
These involve one candle and signal potential reversals or indecision:
-
Doji: Open and close prices are very close, forming a cross or plus shape. Signals indecision, often at tops or bottoms (e.g., a Doji after a GBP/USD uptrend may hint at a reversal).
-
Hammer: Small body with a long lower wick, seen at the bottom of a downtrend. Suggests buyers are stepping in (e.g., a hammer on USD/JPY at support).
-
Shooting Star: Small body with a long upper wick, seen at the top of an uptrend. Indicates selling pressure (e.g., a shooting star on EUR/USD at resistance).
2. Double Candlestick Patterns
These use two candles to signal reversals:
-
Bullish Engulfing: A small bearish candle followed by a larger bullish candle that “engulfs” it. Signals a potential uptrend (e.g., on AUD/USD after a decline).
-
Bearish Engulfing: A small bullish candle followed by a larger bearish candle. Suggests a downtrend (e.g., on EUR/GBP at a peak).
-
Tweezer Tops/Bottoms: Two candles with matching highs (tops) or lows (bottoms), indicating resistance or support (e.g., tweezer bottom on USD/CAD).
3. Multi-Candlestick Patterns
These involve three or more candles, often signaling trend continuations or reversals:
-
Morning Star: A three-candle bullish reversal pattern with a short middle candle (Doji or small body) between a bearish and bullish candle. Seen at bottoms (e.g., on NZD/USD).
-
Evening Star: A three-candle bearish reversal with a short middle candle between a bullish and bearish candle. Seen at tops (e.g., on GBP/JPY).
-
Three Black Crows/Three White Soldiers: Three consecutive bearish (crows) or bullish (soldiers) candles, signaling strong downtrends or uptrends, respectively.
Benefits of Using Candlestick Patterns
Candlestick patterns offer several advantages for forex traders:
1. Clear Market Insights
They reveal market sentiment, showing whether buyers or sellers are in control, helping traders anticipate reversals or continuations.
2. Versatility
Patterns work across timeframes (1-minute to monthly charts) and pairs, suiting scalpers, day traders, and swing traders.
3. Enhanced Decision-Making
Combining patterns with support/resistance or indicators like RSI improves trade accuracy, reducing guesswork.
4. Universal Application
Candlestick patterns are globally recognized, making them effective for all forex markets, from major pairs to exotics.
Risks and Limitations of Candlestick Patterns
Despite their strengths, candlestick patterns have limitations:
1. False Signals
Patterns can fail, especially in volatile markets or during news events (e.g., a bullish engulfing on EUR/USD may reverse if NFP data surprises).
2. Context Matters
Patterns are less reliable without confirmation from other tools, like trendlines or volume, leading to misinterpretation.
3. Learning Curve
Identifying patterns accurately requires practice, as subtle variations (e.g., Doji vs. spinning top) can confuse beginners.
4. Over-Reliance
Focusing solely on candlesticks ignores fundamental factors like interest rates or geopolitical events, which heavily impact forex prices.
How to Use Candlestick Patterns in Currency Trading
To leverage candlestick patterns effectively, follow these steps:
Step 1: Learn Key Patterns
Start with simple patterns like Doji, hammer, and engulfing formations. Study their appearance and implications using free resources like broker tutorials, TradingView guides, or books like Japanese Candlestick Charting Techniques by Steve Nison.
Step 2: Choose a Regulated Broker
Select a broker regulated by the FCA, CFTC, or ASIC, with a platform supporting candlestick charts. MetaTrader 4/5 or TradingView are ideal, offering customizable timeframes and pattern recognition tools. Ensure tight spreads for major pairs like EUR/USD.
Step 3: Practice with a Demo Account
Use a demo account to identify patterns on pairs like USD/JPY or GBP/USD across 1-hour, 4-hour, or daily charts. Test setups like entering a buy on a bullish engulfing at support or a sell on an evening star at resistance. Practice for weeks to build confidence.
Step 4: Develop a Candlestick-Based Strategy
Create a trading plan incorporating candlesticks:
-
Identify Patterns: Spot high-probability patterns at key levels (e.g., hammer at EUR/USD support).
-
Confirm with Tools: Use indicators (e.g., RSI for overbought/oversold) or levels (e.g., Fibonacci) to validate signals.
-
Set Entries/Exits: Enter trades after pattern confirmation, with stop-losses below the pattern (e.g., 10 pips below a hammer) and take-profits at resistance.
-
Manage Risk: Risk 1-2% of your account per trade, adjusting position size based on stop-loss distance.
Step 5: Monitor and Refine
Track trades in a journal, noting patterns, confirmation tools, and outcomes. Review weekly to identify successful patterns (e.g., morning star on USD/CAD) and adjust for false signals or volatile conditions (e.g., during FOMC meetings).
Tips for Mastering Candlestick Patterns
Boost your candlestick skills with these tips:
1. Start with Major Pairs
Trade liquid pairs like EUR/USD or USD/JPY, where patterns are clearer due to high volume and lower volatility.
2. Use Higher Timeframes
Focus on 4-hour or daily charts for more reliable patterns, as 1-minute charts are prone to noise and false signals.
3. Combine with Analysis
Pair candlesticks with technical tools (e.g., Bollinger Bands) and fundamental insights (e.g., economic calendars) to avoid trading during volatile news.
4. Practice Pattern Recognition
Regularly review charts to spot patterns quickly, using TradingView’s replay feature or MT4’s historical data to simulate trades.
5. Stay Disciplined
Avoid forcing trades on unclear patterns. Wait for confirmation and stick to your risk management plan.
Conclusion
Candlestick patterns are a vital tool for currency traders, offering a window into market sentiment and potential price movements. By mastering patterns like Doji, engulfing, and morning star, beginners can enhance their trading strategies and navigate the forex market with confidence. While false signals and context are challenges, combining candlesticks with other tools mitigates risks.
Start with a demo account, focus on major pairs, and practice identifying patterns at key levels. With patience and discipline, candlestick patterns can unlock the potential of currency trading, helping you trade smarter on pairs like EUR/USD or GBP/JPY. Dive in, stay focused, and chart your path to forex success today.